Life-Changing Graphs Explained
Discover the power of visual representation in understanding complex life concepts. Our curated collection of graphs offers unique insights into various aspects of personal and professional growth, technology trends, and societal patterns.
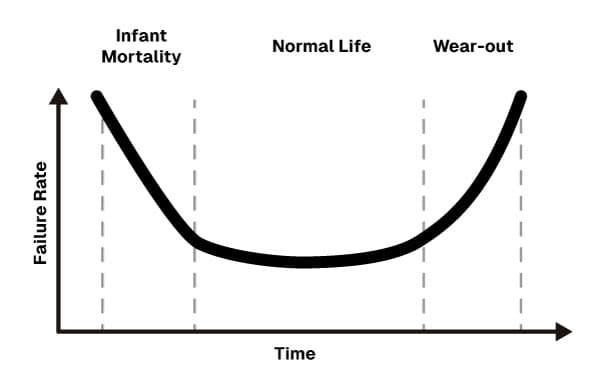
The Bathtub Curve
Failure Rate over Time
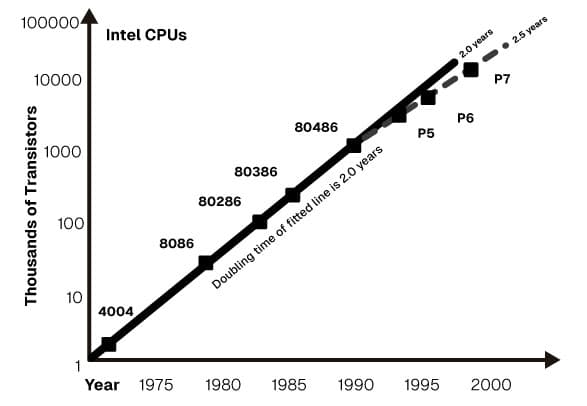
Moore's Law
Technological Progress
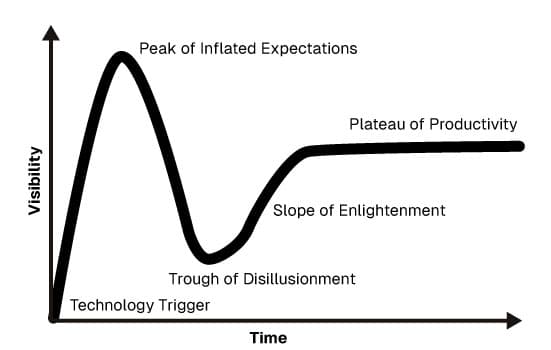
The Hype Cycle
Technology Adoption
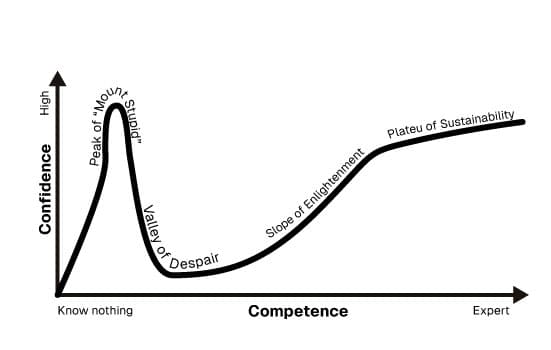
The Dunning-Kruger Effect
Confidence vs. Competence
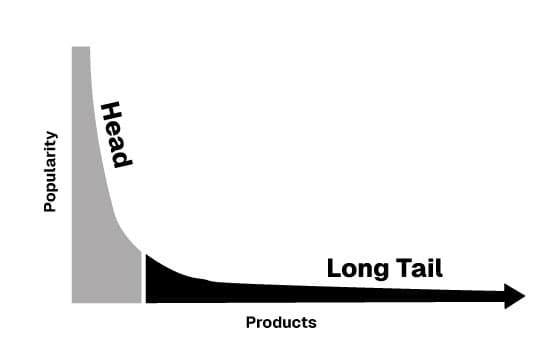
The Long Tail
Niche Markets
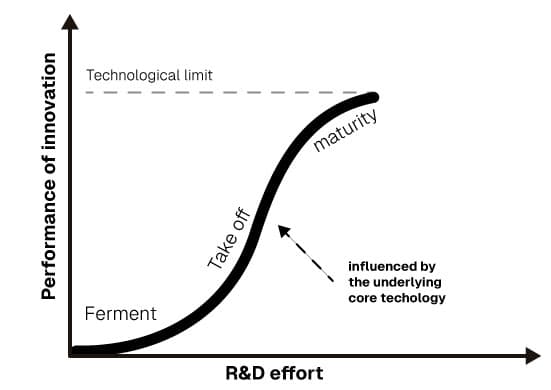
The S-Curve of Innovation
Growth and Maturity
Unlock the Power of Visual Life Evaluation
Dive deeper into these graphs and many more with our upcoming book, “Graphing Your Life: A Comprehensive Approach to Personal Growth”. Learn how to apply these powerful concepts to enhance every aspect of your life.